International equities update: Rising inflation and interest rate concerns hit growth stocks
The information in this article is current as at 1 April 2022.
Overview
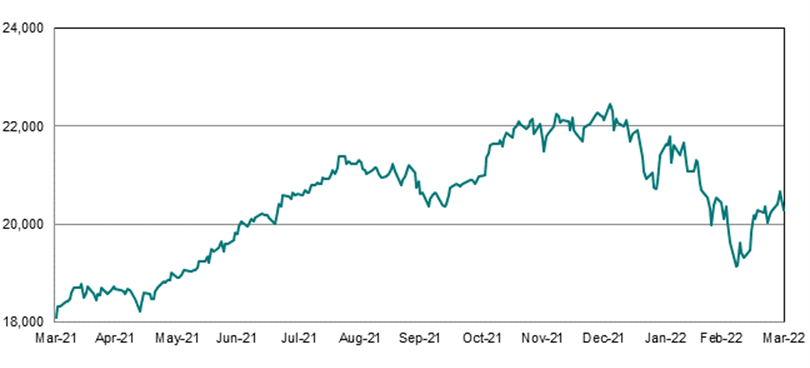
The MSCI World (ex-Australia) Accumulation Index (AUD) returned -8.3% over the three months and 2.4% over the nine months to 31 March 2022.
MSCI World ex-Australia Accumulation (Gross) Index (AUD)

Source: MSCI
Outlook
The commodity complex (Resource and Energy sectors) outperformed strongly as commodity prices soared following strong energy demand from Europe and the Russian invasion of Ukraine. Sectors prized for their “secular growth” story (ability to grow regardless of the economic environment), such as technology, were the most punished, weighed down by a more aggressive outlook on interest rates. Over the next 12 months we expect that corporate earnings will continue to grow, but at a slower pace than in 2021. The withdrawal of both government and central bank support remains a notable headwind to earnings growth, with a commodity price shock following the Russian invasion of Ukraine being another negative impact on corporate earnings.
Earnings growth outlook at 17 March 20221
| Region | 2021 earnings | 2022 earnings (forecast) |
| US | 51.9% | 9.5% |
| World ex-US | 56.1% | 8.9% |
| World | 53.9% | 9.2% |
The above table is likely overstating expectations for 2022 given the gradual adjustment of earnings to new information, in this case, the shock to commodity prices. The expectation of weaker global economic growth will mean less revenue growth and therefore lower profit growth in 2022. Other dangers to the outlook include:
- Tighter financial conditions (rate hikes increasing borrowing costs and slowing demand for credit)
- Reduced government spending after the end of the coronavirus emergency period 2020-21
- Emergence of new coronavirus variants.
Interest rate hikes in the United States have repriced sizeably since the beginning of the year with the Federal Reserve revising its forward guidance for 2022 even further from a range of 0.75-1% to 1.75-2%, factoring in an additional four hikes of 0.25%.
One factor offering some relief is the correction in global equities which has seen valuations trade at more reasonable levels. However, we caution that:
- Shares can fall further when interest rates rise as it makes equites relatively less attractive compared to cash or bonds, and
- The above risks highlight the threat to earnings with the higher inflation outlook pressuring corporate margins, especially where businesses are unable to pass on costs.
Even after recent weakness, the US remains overvalued (investors overpaying at current share prices) with potential downside corrections ranging from 15% to 27%. The US accounts for the vast majority of total market value in global equities (68.5% as of 28 February), so this downside scenario suggests caution remains advised for overall international exposure.
Valuations
In the United States, operating earnings for S&P 500 companies are currently expected to rise by 8.2% in 2022 and 9.4% in 2023. Assuming a 6.3% growth rate in 2024 (in line with conventional long-term multiples), we estimate that the United States sharemarket (as measured by the S&P500) is overvalued by between 19% in the near-term and 6% over the medium-term.
| 2021 calendar year forecast | EPS earnings estimates (US$) | S&P 500 fair value estimate | Upside/(downside) S&P 500 = 4,456 |
| Consensus | $225 | 3,600 | (19)% |
| If 10% below | $203 | 3,241 | (27)% |
| If 10% above | $248 | 3,961 | (11)% |
| 2022 calendar year forecast | EPS earnings estimates (US$) | S&P 500 fair value estimate | Upside/(downside) S&P 500 = 4,456 |
| Consensus | $246 | 3,940 | (12)% |
| If 10% below | $222 | $3,546 | (20)% |
| If 10% above | $271 | 4,333 | (3)% |
| 2023 calendar year forecast | EPS earnings estimates (US$) | S&P 500 fair value estimate | Upside/(downside) S&P 500 = 4,456 |
| Consensus | $261 | 4,184 | (6)% |
| If 10% below | $236 | 3,776 | (15)% |
| If 10% above | $288 | 4,609 | 3% |
Source: S&P consensus estimates for 2022 and 2023 at 24 March 2022. 2024 assumes a growth rate of 6.3%2
In contrast, forward Price-to-Earnings (P/E) multiples broadly remain either below or in-line with longer-term averages in most other major markets, as follows:
| Region | MSCI forward PE3 |
| All Country World (ex-US) | 16.0 |
| Emerging Markets | 11.0 |
| United Kingdom | 11.0 |
| Japan | 12.4 |
| Eurozone | 12.8 |
| China | 8.7 |
Conclusion
Recommendation: Retain underweight.
We anticipate earnings growth to be positive in 2022 (supported by strong labour markets, consumer spending and elevated household savings) but weaker than 2021 given headwinds from rising inflation, which will divert spending towards essential goods, such as fuel, and also negatively impact profit margins (to the extent that businesses cannot pass higher inflation on to their customers). Share prices are also expected to be challenged by the tightening cycle in the United States, which will make other asset classes such as cash and bonds relatively more attractive, posing a headwind to further price appreciation.


