The health and economic impact of Covid-19 is unprecedented. Economies are also facing enormous turmoil and businesses of all sizes are being tested. Significant changes to the economic environment require entities to test assets and cash generating units (CGU’s) for impairment, particularly goodwill.
Impairment testing involves a comparison of the carrying value of an asset or CGU with its recoverable amount. The recoverable amount is typically calculated as the present value of future cash flow streams expected to be derived from the asset or CGU, applying an appropriate discount rate. The cost of equity is the most significant aspect of the discount rate, requiring substantial judgement.
In these extraordinary times, how is the cost of equity adjusted (and how are cashflows estimated)?
When helping companies we consider the following:
Cost of equity
The cost of equity is the rate of return required by equity investors. The Capital Asset Pricing Model (CAPM) is the most widely accepted and used methodology for determining the cost of equity. The CAPM assumes that a rational investor will value an asset based on: the expected rate of return equal to the risk-free rate plus a premium for the risk profile of the asset
The market risk premium (MRP) represents the additional return that investors require to invest in equity securities, compared to a risk-free investment. For practical reasons, the historical MRP is generally used to estimate the future MRP on the basis that long-term average excess annual returns on equities relative to government bonds would be a proxy of what investors would expect to earn in the future, over the medium to long term.
However, this approach has limitations during a period of heightened risk like the present.
An alternative approach is to estimate a forward-looking cost of equity. When investors value assets they base the value on expected future cash flows and the required return on that asset. Accordingly, the expected return may be implied using share prices and expected future cash flows.
Share prices have fallen across most sectors reflecting lower expected cash flows, greater uncertainty regarding future cash flows and/or increased risk aversion. Investors are charging a higher price for risk, increasing the cost of equity. This results in lower prices for the same expected cash flows.
We have applied a forward-looking approach and considered market evidence to estimate a COVID-19 risk premium for the cost of equity (refer to Section A below),and compared our observations to risk premiums observed during the Global Financial Crisis (refer to Section B below).
A. Earnings yield changes from 31 December 2019
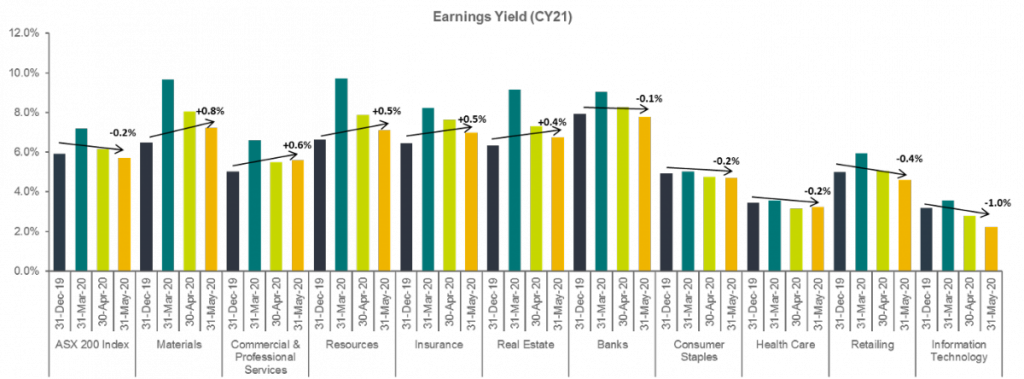
We have calculated changes to the expected earnings yield[1] of different industries from December 2019 to May 2020. This is market-based evidence of an additional premium included the cost of equity this calendar year.

Source: S&P Capital IQ, Pitcher Partners analysis
The chart indicates that:
- Overall, the S&P ASX 200 earnings yield has decreased modestly in the 5 months to May 2020. This total market view partly conceals some offsetting yield movements of specific sectors.
- The Materials, Commercial & Professional Services, Resources, Insurance and Real Estate sectors (Upward Yield Sectors) show a rise in earnings yield of up to 0.8%.
- In contract, the earnings yield of the Banks, Consumer Staples, Heath Care, Retailing and Information Technology sectors (Downward Yield Sectors) have decreased by up to 1.0%.
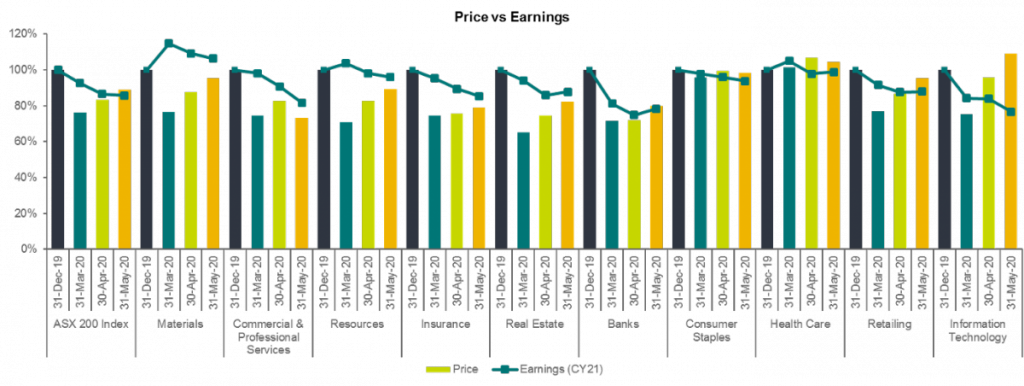
Below illustrates the movement of the two earnings yield components (earnings and price), indexed to 100 at December 2019:

Source: S&P Capital IQ, Pitcher Partners analysis
The chart indicates that:
- The Upward Yield Sectors show a larger fall in price relative to earnings (with an earnings lift for Materials). The opposite effect occurs with the Downward Yield Sectors, with a greater fall in earnings relative to price (with a price increase for Information Technology).
- Prices fell sharply for most sectors in the period to March 2020 and have recovered somewhat in April and May 2020.
- Earnings estimates lagged share price falls and have generally decreased from March to May 2020 as the investors assessed the earnings impact of Covid-19.
We recognise the above analysis is a broad overview of selected market sectors, with some simplifying assumptions. For example, we assume:
- Earnings for CY21 are a proxy for forward-looking base case earnings (i.e. earnings have normalised by CY21). Some industries may have longer recovery periods. Higher CY22 earnings expectations would increase the earnings yield.
- Price movements mainly reflect earnings expectation from CY21 onwards, and are less impacted by CY20 earnings expectations.
- Long-term earnings growth rate has remained constant.
We believe that simplifying assumptions are a necessary starting point given the uncertain and volatile environment. These simplifying assumptions may be validated or modified on a case-by-case basis recognising that sector indices may not represent the profile all the companies in that sector and multi-scenario modelling may be preferred for such companies.
B. Global Financial Crisis (GFC)
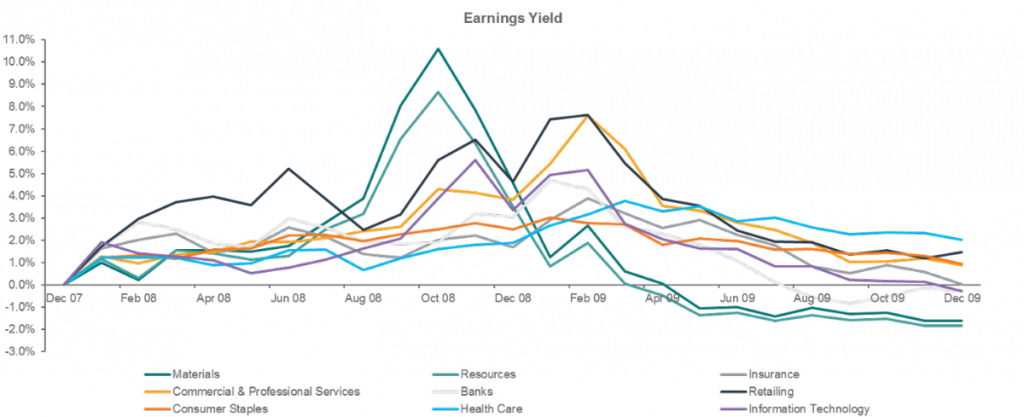
The GFC provides a useful comparison of a global crisis impact on the cost of equity, notwithstanding the significant differences between the GFC and Covid-19. A higher cost of equity was also observed during the GFC. The chart below illustrates the changes to forecast earnings yields from December 2007 to December 2009.

Source: S&P Capital IQ, Pitcher Partners analysis
The chart indicates that:
- Earnings yields of most sectors increased by 0.5% – 2.5% from December 2007 to August 2008. The collapse of Lehman Brothers in September 2008 and its adverse impact on the global financial system caused a general spike in earnings yields (particularly Materials and Resources with a more lagged impact on Retailing and Commercial & Professional Services).
- From mid-2009, the earnings yield premiums dropped to below 2.5% relative to December 2007 (with the Materials and Resources sectors experiencing lower yields than pre-GFC).
Cashflows
Whilst an adjustment to the cost of equity accounts for the additional risk premium commanded by equity investors for the uncertainty resulting from Covid-19 for the market or industry as a whole, adjustments to forecast cash flows are also required to account for the Covid-19 specific impacts on the earnings of the company. However, a balance needs to be struck between these adjustments to ensure expected impacts are not double counted.
Add to this the additional scrutiny which auditors are likely to apply when reviewing the forecast cash flows, and the importance of revisiting existing budgets and forecasts become self-evident.
Depending on the level of detail used in existing forecasts, and the extent of the Covid-19 impact on the company, existing forecasts may be used as a starting point in preparing revised forecasts. For most companies however, a complete overhaul of the forecast model may be required. It is therefore imperative that forecasts used for impairment testing are revisited at an early stage. Communication with audit team in the lead-up to the audit is just as important, to ensure that the process and deliverable meet their expectations and provide the necessary assurance.
The below should help you to navigate the intricacies of cashflow forecasting for impairment testing in the time of Covid-19:
| Forecasting tips & techniques | Considerations | Sources of information |
| Apply scenario analysis to your forecasts |
|
Impairment Testing Model (Excel) |
| Use external evidence as far as possible to support forecast assumptions | Assumptions to consider include:
|
|
| Consider recent financial performance, even if negative trend |
|
Historical performance of the company, in particular post-February 2020 |
| Consider the impact of AASB 16 – Leases | EBITDA no longer includes lease payments, therefore:
|
AASB 16 Leases and AASB 136 Impairment of Assets |
| Keep the accounting standards in mind |
|
AASB 136 Impairment of Assets |
| Communication with your audit team |
|
N/A |
If you have a question about this or any other valuation issue, please contact the Pitcher Partners team.
[1] Earnings (CY21) / price


